
2012 Finance Report
Overview
This is the 2012 financial report for Quartz Hill Community Church. It starts with this overview of the year. Following the overview there is detailed information about fund balances and the budget.
Our 2012 financial history is probably best characterized by greater financial stability. After catching up in 2011 we started 2012 near even. As usual we had our ups and downs. However, we generally kept up with our bills. Near the end of the year we lost a little with giving a bit down and property taxes to pay. Giving improved a bit in December and we recovered to pay all our bills by year end. We ended up with a slightly negative General Fund balance of -$358. Overall, though we ended with our bills paid and money in the bank.
Our biggest on-going concern the last few years has been that we struggle to make our building mortgage payment. In 2011 the North American Mission Board agreed to extend our maturation date and lower our payment. As a result we did much better in 2012, only falling behind late in November when we also had to pay property tax.
The stability in our giving allowed us to pay our pastor and our bills regularly. Looking forward this kind of stable pattern is encoraging.
Balances
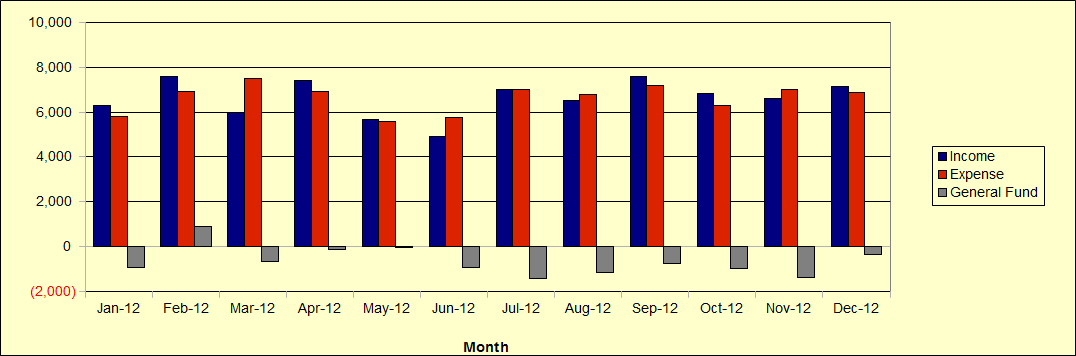
The table below shows the balances of the various QHCC funds at the end of each month in 2012. The chart below the table shows the General Fund history. The chart includes unpaid bills in the General Fund balance to show when we are behind. All funds are contained in the QHCC Account, which means that the QHCC Account column is a total of the rest. Most income and spending occurs through the General Fund.
The Parsonage Fund has funds primarily from parsonage refinancing and is used to care for and maintain the parsonage. The Deacon Fund is usually donated to every communion service and is used to help people in need. At the 2008 budget meeting we voted to set up the Holding Fund. It is designed to hold funds needed to pay irregular large bills such as the property tax. Currently we are behind in our bills so the Holding Fund has no money. Periodically youth at the church raise money and this money is stored in the Youth Fund.
The Internet and Temporary Funds should normally show zero balances. The Internet Fund tracks Quartz Hill School of Theology's support for our internet fees. The Temporary Fund covers money taken in for things not budgeted, such as Souper Bowl or the Lottie Moon offering.
| Date | QHCC Account | General | Gen - Hold | Parsonage | Deacon | Holding | Youth | Internet | Temporary |
|---|---|---|---|---|---|---|---|---|---|
| Dec-11 | 1,782 | (250) | (250) | 935 | 835 | 0 | 260 | 0 | 0 |
| Jan-12 | 2,058 | 214 | 214 | 935 | 647 | 0 | 260 | 0 | 0 |
| Feb-12 | 2,754 | 885 | 885 | 935 | 672 | 0 | 260 | 0 | 0 |
| Mar-12 | 1,376 | (645) | (645) | 935 | 734 | 0 | 260 | 0 | 90 |
| Apr-12 | 2,503 | (144) | (144) | 935 | 787 | 0 | 260 | 0 | 662 |
| May-12 | 2,231 | (56) | (56) | 935 | 787 | 0 | 260 | 0 | 303 |
| Jun-12 | 535 | (925) | (925) | 385 | 509 | 0 | 260 | 0 | 303 |
| Jul-12 | 539 | (921) | (921) | 385 | 509 | 0 | 260 | 0 | 303 |
| Aug-12 | 392 | (1,168) | (1,168) | 385 | 540 | 0 | 260 | 0 | 373 |
| Sep-12 | 893 | (765) | (765) | 385 | 638 | 0 | 260 | 0 | 373 |
| Oct-12 | 1,395 | (264) | (264) | 385 | 638 | 0 | 260 | 0 | 373 |
| Nov-12 | 1,077 | (637) | (637) | 385 | 697 | 0 | 260 | (4) | 373 |
| Dec-12 | 1,330 | (358) | (358) | 385 | 637 | 0 | 260 | 0 | 403 |
Here is the chart showing the General Fund balances, income and expenses throughout the year.
Budget
This table shows the how income and spending compare with the budget throughout the year. The left-hand column shows the budget categories and sub-categories. Next to it the Budget Column shows the monlthy budgeted amounts for each category. The next columns show the income and spending for each month. The Total YTD Column shows the total income and spending for the year to date. The Budget YTD Column shows the amount budgeted for the year to date. The Difference Column shows the difference between actual income and spending and the budget for the year to date. The Annual Budget Column shows the yearly budget amounts.
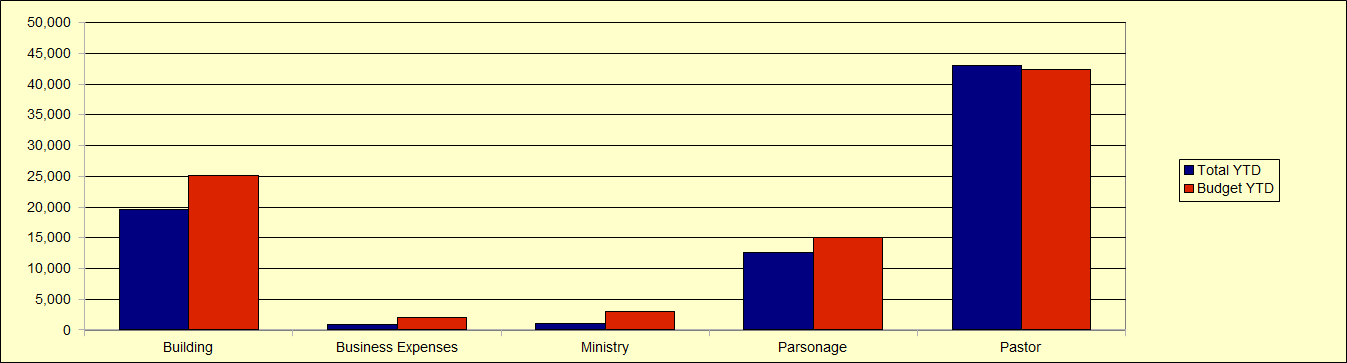
This chart shows spending compared to the budget for the major budget categories.
Copyright © Quartz Hill Community Church. All Rights Reserved.